


 50 / 97

Unimed System Sustainability Report
50
CONTENTSINTRODUCTION GOVERNANCE AND MANAGEMENT
ECONOMIC HEALTH SOCIAL HEALTH ENVIRONMENTAL HEALTH
EXHIBITS
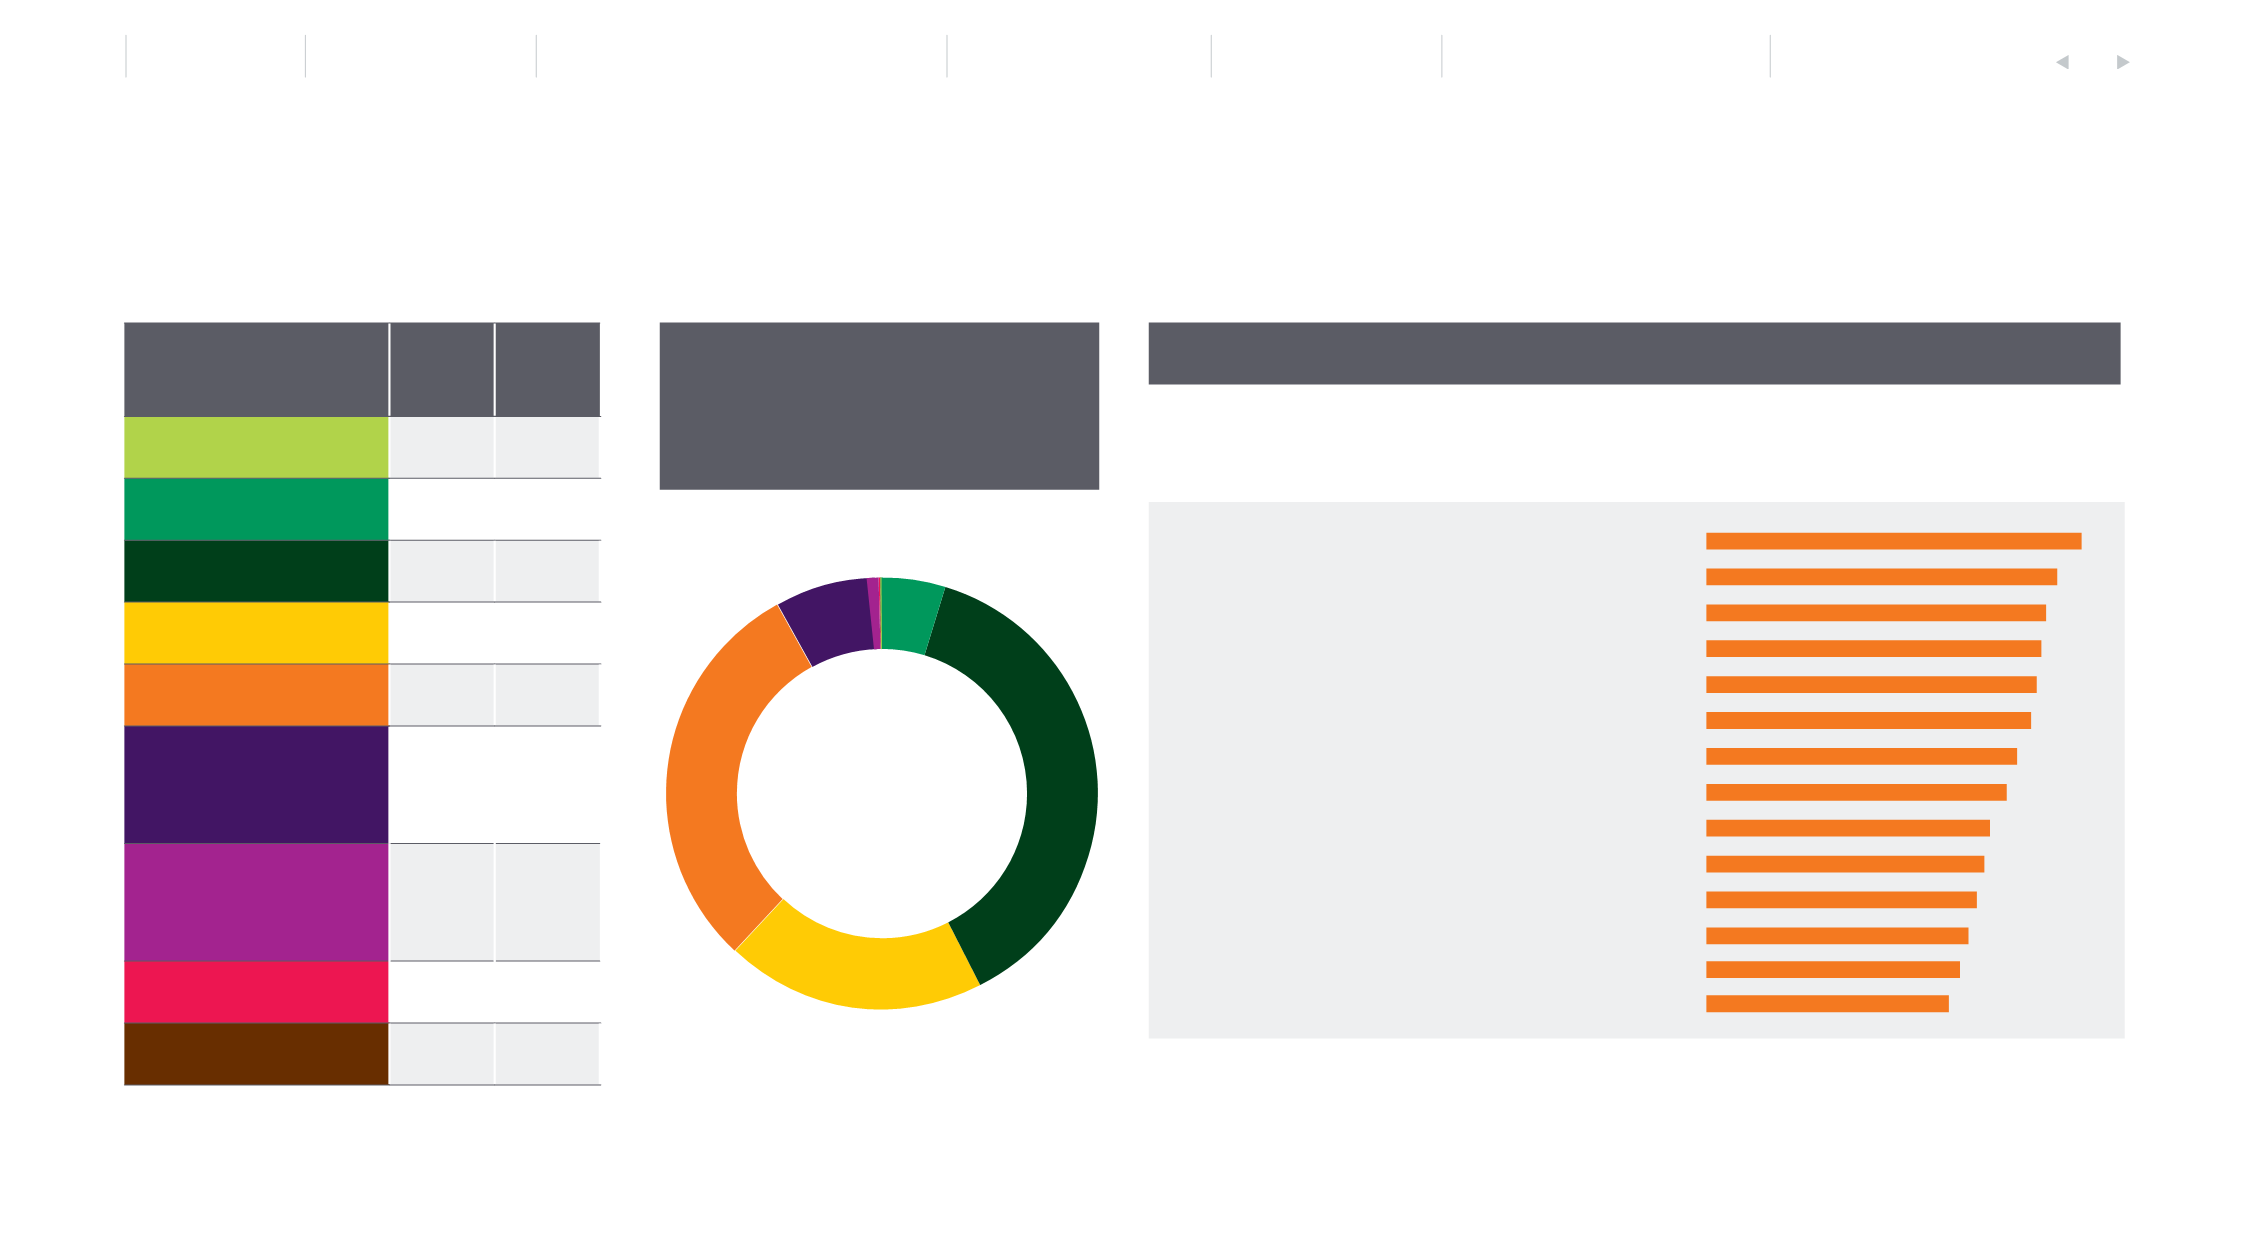
The distribution of the 86,933 employees according to schooling level is expressed in the table and graphic below. Consolidated indicators may represent, besides the operators school-
ing level, the schooling level of employees of some of the own resources (hospitals, laboratories, Unimed drugstores) having a difference formation level profile, as they provide health
assistance in a more direct way.
Employees’ schooling
2013 2014
Illiterate
82
47
Primary school
3,632
4,135
Secondary school
29,980 32,797
Technical school
16,176 17,074
Higher education
24,645 25,879
Lato sensu
post-graduation
(specialization, MBA)
6,286 6,707
Stricto sensu
post-graduation
(master’s degree, Ph.D.)
235
290
Post-doctorate
4
3
Substitute professorship
1
1
Source: Você S/A Special Edition - The best companies where to work - 2014
Hospital Unimed Sul Capixaba
83,4%
Unimed Sul Capixaba
79,7%
Central Nacional Unimed
78,7%
Unimed Governador Valadares
78,3%
Unimed Vales do Taquari e Rio Pardo
77,5%
Unimed Missões/RS
77,3%
Unimed do Estado de São Paulo
75,0%
Unimed São José do Rio Preto
73,4%
Unimed Central de Serviços RS
72,8%
Seguros Unimed
72,5%
Unimed Rio
72,3%
Unimed Volta Redonda
72,2%
Unimed Caruaru
70,4%
Unimed Porto Alegre
68,5%
The best companies where to work - Work Happines Index (IFT)
Employees distribution according to
schooling level, per intervals
General Performance 2014
Out of the 16 cooperatives included in the Você S/A ranking of
the 150 best companies where to work, 14 are Unimed
47
4,135
32,797
17,074
25,879
6,707
290
1
3